STM32CubeIDE Explained: A Beginner’s Guide
If you have followed along with the previous guide in this series, you already have a CubeMX project configured on your computer, generated and ready to go. That project contains a full set of initialization code: your clocks are configured, your GPIO pins are assigned, and your peripherals are set up. What it does not have yet is a way to turn that code into a program running on real hardware.
That is where STM32CubeIDE comes in. It is the tool that takes the project CubeMX generated, compiles it into a binary the microcontroller can understand, sends that binary onto the chip, and lets you step through your code line by line while it runs. If CubeMX is where you describe what the hardware should look like, CubeIDE is where you actually bring that hardware to life.
This guide resume from exactly where the CubeMX guide ends. We will open the generated project in STM32CubeIDE, look at how it is organized, and figure out where your own application code is supposed to go. Then we will walk through the complete process of building the project, flashing it onto a board using ST-LINK, and running it under the debugger. Along the way we will use the same working example from the previous guide, an LED on PA5 and a button on PC13, and take it all the way from generated code to a blinking LED.
Table of contents
- STM32CubeIDE Explained: A Beginner’s Guide
- What Is STM32CubeIDE?
- STM32CubeIDE Project Structure Explained
- Where Should You Write Your Code?
- Building an STM32 Project
- Programming and Flashing with ST-LINK
- Running and Debugging an STM32 Application
- Breakpoints, Watch Variables and Stepping
- Understanding Build and Debug Configurations
- Common Build and Flashing Errors
- Complete Build, Flash, and Debug Workflow
- Wrapping Up
What Is STM32CubeIDE?
STM32CubeIDE is the official integrated development environment (IDE) from STMicroelectronics for STM32 microcontrollers. It is built on the Eclipse platform, and it combines several tools into one application: a C and C++ code editor, a compiler toolchain built around GCC, and a debugger based on GDB.
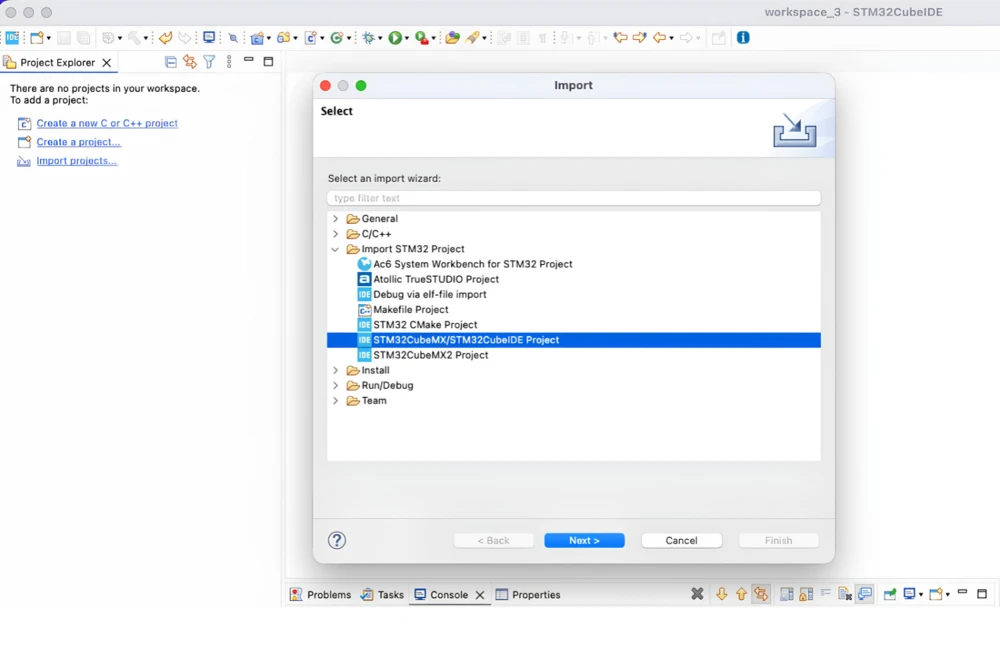
CubeIDE is a separate application from STM32CubeMX. You configure your project, set the pinout, clocks, and peripherals, and generate the initialization code in CubeMX, then import that generated project into CubeIDE for writing application code, building, flashing, and debugging. The two tools work closely together even though they are separate windows: whenever you need to change the hardware configuration, you open the .ioc file in CubeMX, make the change, regenerate the code, and then switch back to CubeIDE to build and debug.
Before this workflow, and before CubeIDE existed at all, a typical STM32 project involved CubeMX to generate the project, and then a separate IDE such as Keil MDK-ARM or IAR Embedded Workbench to build and debug it. Both of those are still valid choices, and some teams stick with them for reasons such as existing licenses or long-standing project setups. STM32CubeIDE has an advantage that matters a lot for anyone starting out. Even though it is free, it is maintained directly by STMicroelectronics, and it works the same way across every STM32 family, from the smallest low-power chips to the larger H7 devices.
It also helps to know what CubeIDE cannot do for you. It will not teach you how your chip works, and it will not stop you from making mistakes. If you write code that does not make sense for your hardware, CubeIDE will still compile it without complaint. If your code conflicts with how you set up a peripheral in CubeMX, CubeIDE will not catch that either. What it does instead is make it easy to get your code onto the chip and watch it run, so you can spend your time and attention on writing correct application logic, not on fighting the tools.
STM32CubeIDE Project Structure Explained
When you open the project generated in the previous guide, either by importing it or by opening the workspace CubeMX pointed to, STM32CubeIDE loads it into the Project Explorer panel on the left-hand side of the window. This is your map of the project, and it is worth getting familiar with it before writing any code.
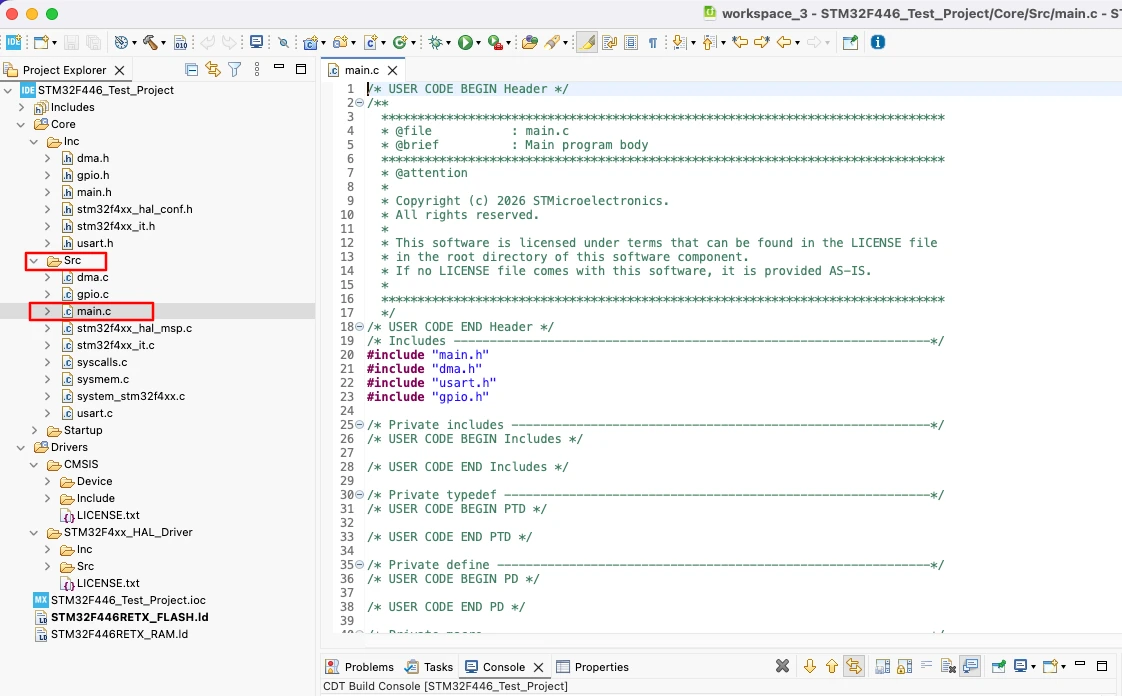
A typical generated project is organized into a small number of folders, and each one has a clear job.
- Core holds the parts of the project that are specific to your application. Inside it,
Core/Inc contains header files, including
main.h, and
Core/Src contains source files, including
main.c. This is the folder you will spend the most time in.
- Drivers contains the HAL (or LL) library code that CubeMX generated for your chip, along with the CMSIS files that define the core and device-specific register structures. You will rarely need to edit anything inside this folder directly. It exists so that the HAL function calls in your own code, things like
HAL_GPIO_WritePin(), actually have an implementation behind them.
- Debug or Release, depending on which build configuration is active, is where the compiled output ends up. This folder is generated by the build process itself, and you do not need to create or manage it by hand.
- At the root of the project, you will also find the .ioc file, the same one you worked with in CubeMX.
Looking inside Core/Src/main.c is a good next step. If you followed the working example from the CubeMX guide, you should recognize the shape of it immediately: a call to SystemClock_Config(), a call to MX_GPIO_Init(), and a call to MX_USART2_UART_Init(), followed by an infinite while (1) loop near the bottom of the file. This is the same file CubeMX generated, now sitting inside a project that CubeIDE knows how to build.
Where Should You Write Your Code?
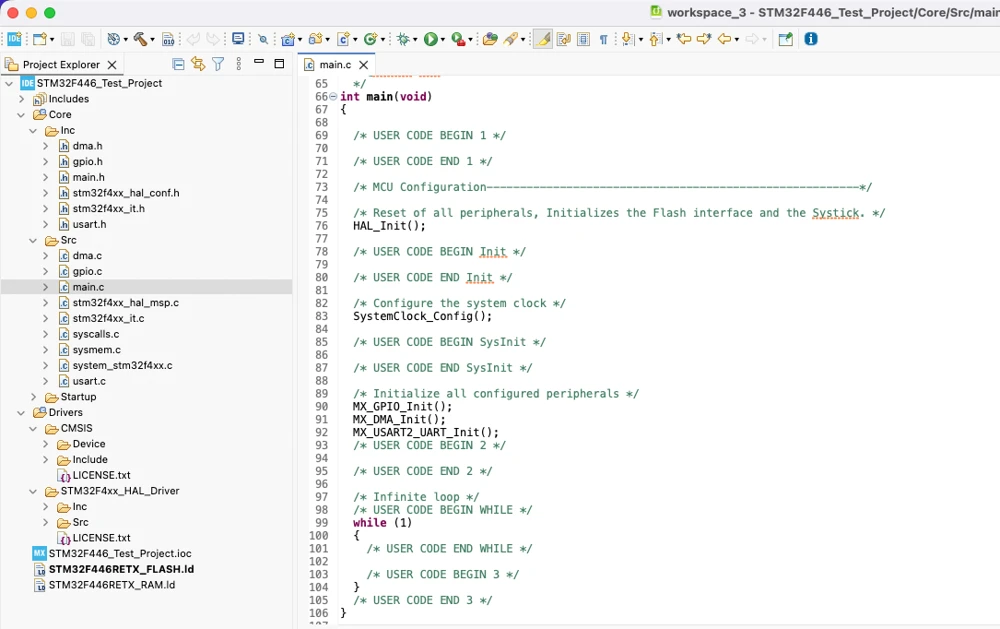
This is one of the first questions that trips up people who are new to CubeMX-generated projects, and it carries over directly into CubeIDE. The short answer is: your code belongs between the USER CODE comment markers, and nowhere else.
Scrolling through main.c, you will see comment pairs scattered throughout the file, looking something like this:
|
1 2 3 |
/* USER CODE BEGIN 2 */ /* USER CODE END 2 */ |
Anything you type between a matching BEGIN and END pair survives the next time the project is regenerated from CubeMX, even after you have gone back and changed a pin assignment or added a new peripheral. Anything typed outside of these markers, including code added directly inside the auto-generated initialization functions, gets silently overwritten the next time code is generated. This was covered in detail in the CubeMX guide, and it matters just as much here, because CubeIDE is where you will actually be typing that code.
For the working example, this is where the LED-blinking logic goes. Near the top of the infinite loop, you will find a marker pair that looks like this:
|
1 2 3 4 5 6 7 8 9 |
while (1) { /* USER CODE END WHILE */ /* USER CODE BEGIN 3 */ HAL_GPIO_TogglePin(GPIOA, GPIO_PIN_5); HAL_Delay(1000); } /* USER CODE END 3 */ |
Between those two lines, you can add a call to toggle the LED pin and a short delay, for example using HAL_GPIO_TogglePin() on the port and pin connected to PA5, followed by HAL_Delay() with a value in milliseconds. This is a small piece of code, but it is a genuinely useful one to type out by hand the first time, rather than pasting it in, simply because it forces you to look at exactly where it sits inside the marked section.
Building an STM32 Project
Once there is some code worth compiling, the next step is building the project. In STM32CubeIDE, this is done either through the hammer icon in the toolbar, through the Project menu, or with the keyboard shortcut Ctrl+B on Windows and Linux.
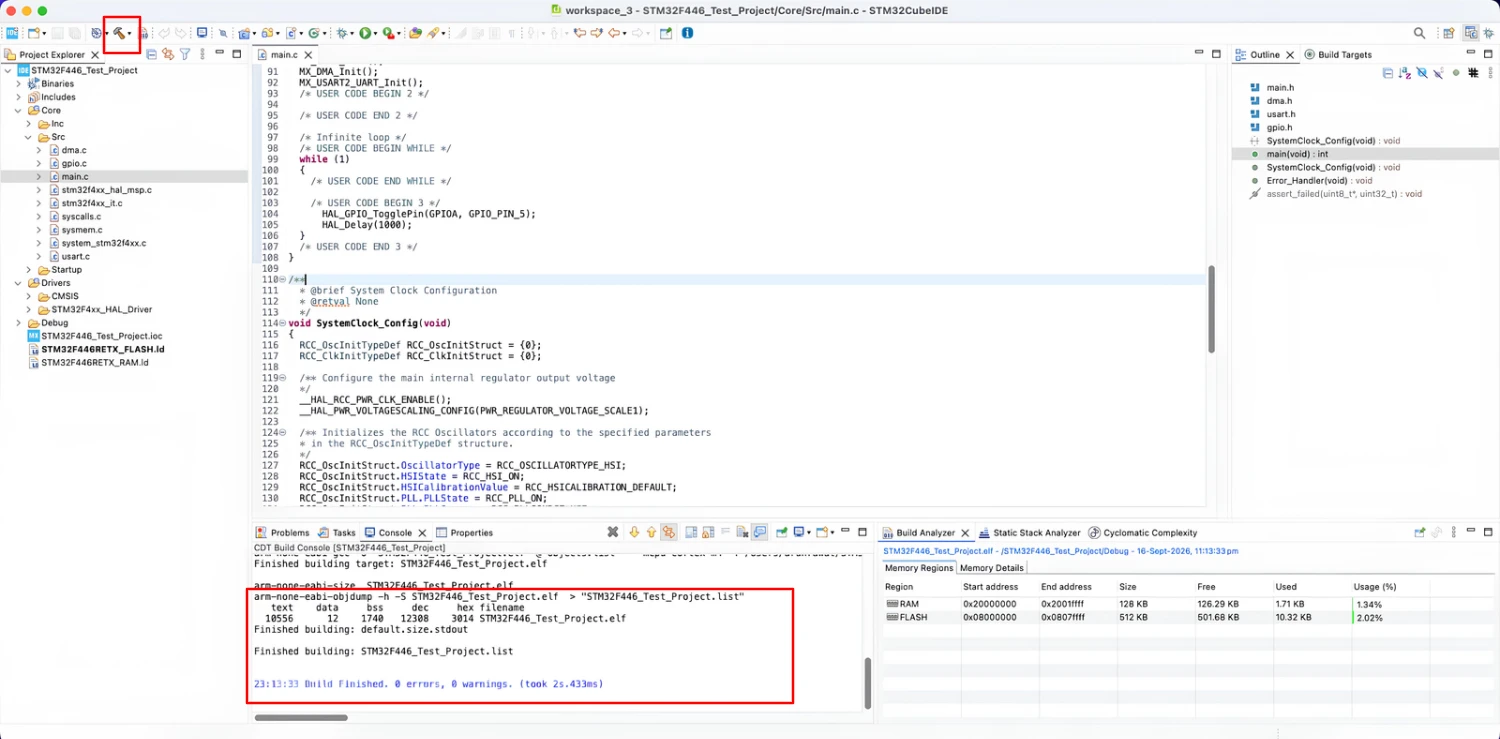
Behind the scenes, building the project runs the GCC toolchain that came bundled with CubeIDE. Every .c file in the project is compiled into an object file, and then everything is linked together into a single output file (in the ELF format), which also gets converted into .bin and .hex versions depending on your project settings. This entire process is visible in the Console panel at the bottom of the window.
A successful build ends with a short summary showing how much of the chip’s flash and RAM your program is using, something like:
   text	   data	    bss	    dec	    hex	filename
  10556	 12	       1740	   12308	    3014	STM32F446_Test_Project.elf
This summary is useful to keep an eye on, especially as a project grows. Flash and RAM are fixed and limited resources on a microcontroller, and watching these numbers climb over time gives you an early warning before you run into a situation where the chip simply does not have enough memory left for what you are trying to add.
If the build fails instead, the Console panel shows the compiler errors, usually with the file name and line number where the problem was found. Clicking directly on an error message in the Console jumps the editor straight to that line, which is a small feature but a genuinely time-saving one once you get used to it.
Programming and Flashing with ST-LINK
A successful build produces a binary file inside on your computer, but that file needs to make its way onto the microcontroller before anything actually happens on the hardware. This step is called flashing, and on most STM32 development boards it happens through a small onboard debugger and programmer called ST-LINK.
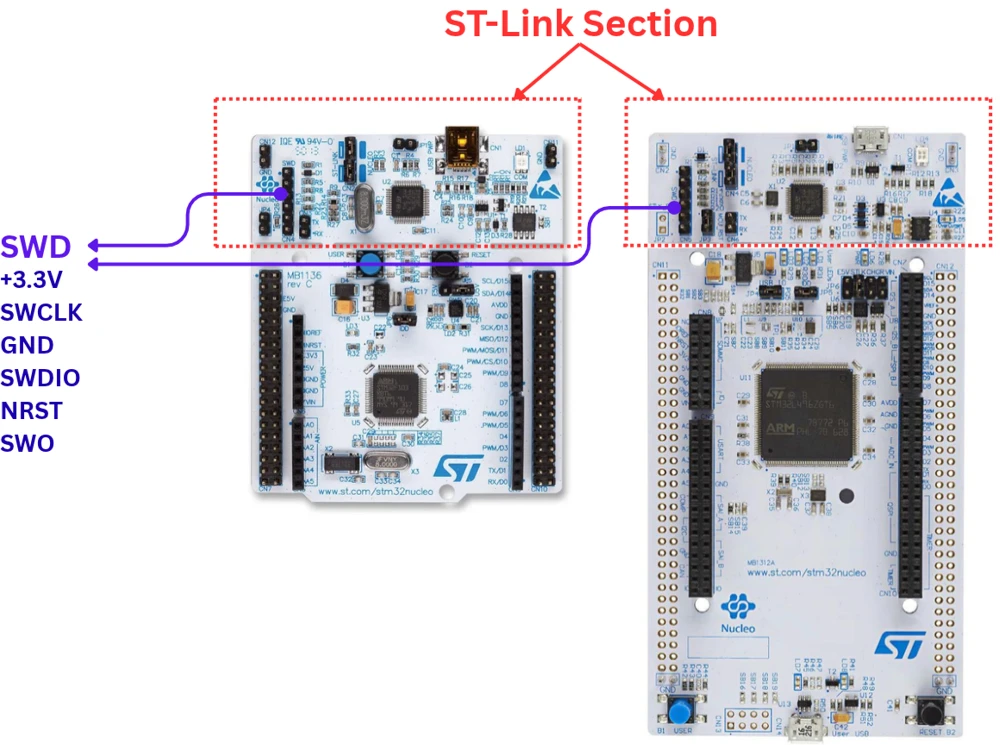
If you are using an official Nucleo or Discovery board, the ST-LINK debugger is already built into the board itself, and connecting the board to your computer with a single USB cable is enough. STM32CubeIDE detects the connected ST-LINK automatically and uses it as the default programming and debugging interface, so in most cases there is no extra setup required beyond plugging the board in.
To flash the project without starting a debug session, you can use the Run button in the toolbar, shaped like a green play arrow, or the equivalent option from the Run menu. This builds the project if it has not already been built, connects to the ST-LINK, erases the relevant portion of flash memory on the chip, writes the new binary, and then lets the program start running immediately on the board.
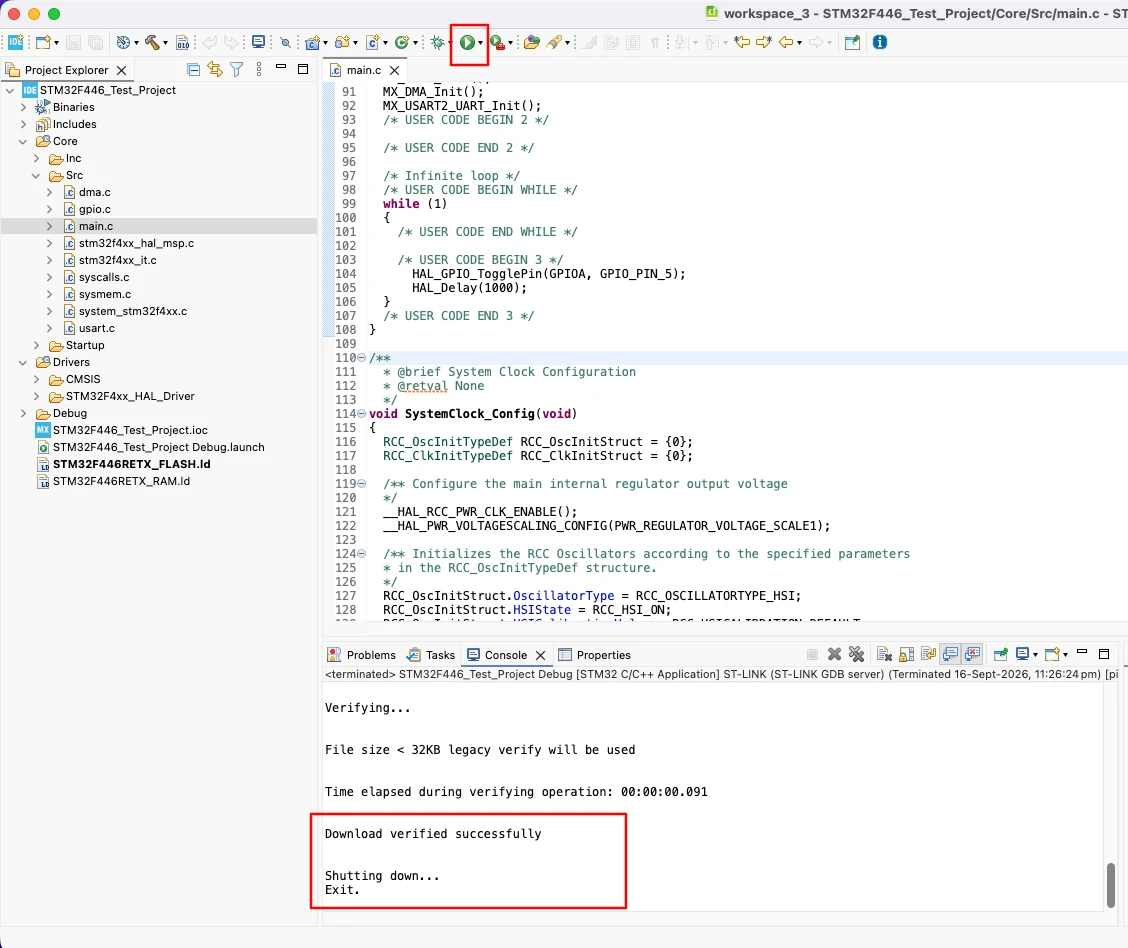
Following are the logs generated in the console while flashing:
|
1 2 3 4 5 6 7 8 9 10 11 12 13 14 15 16 17 18 19 20 21 22 23 24 25 26 27 28 29 30 31 32 33 34 35 36 37 38 39 40 41 42 43 44 45 46 47 48 49 50 51 52 53 54 55 56 57 58 59 60 61 62 63 64 65 66 67 68 69 70 71 72 73 74 |
STMicroelectronics ST-LINK GDB server. Version 7.14.0 Copyright (c) 2026, STMicroelectronics. All rights reserved. Starting server with the following options: Persistent Mode : Disabled Logging Level : 1 Listen Port Number : 61234 Status Refresh Delay : 15s Verbose Mode : Disabled SWD Debug : Enabled InitWhile : Enabled Waiting for debugger connection... Debugger connected Waiting for debugger connection... Debugger connected Waiting for debugger connection... ------------------------------------------------------------------- STM32CubeProgrammer v2.23.0 ------------------------------------------------------------------- Log output file: /tmp/STM32CubeProgrammer_dYjyFD.log ST-LINK SN : 0670FF525750877267152641 ST-LINK FW : V2J46M33 Board : NUCLEO-F446RE Voltage : 3.24V SWD freq : 4000 KHz Connect mode: Under Reset Reset mode : Hardware reset Device ID : 0x421 Revision ID : Rev A Device name : STM32F446xx NVM size : 512 KBytes Device type : MCU Device CPU : Cortex-M4 BL Version : 0x90 Opening and parsing file: ST-LINK_GDB_server_4mI9KN.srec Memory Programming ... File : ST-LINK_GDB_server_4mI9KN.srec Size : 10.32 KB Address : 0x08000000 Erasing memory corresponding to segment 0: Erasing internal memory sector 0 Download in Progress: File download complete Time elapsed during download operation: 00:00:00.545 Verifying... File size < 32KB legacy verify will be used Time elapsed during verifying operation: 00:00:00.091 Download verified successfully Shutting down... Exit. |
For the working example, this is the point where the LED on PA5 should start blinking, assuming the wiring matches what was configured in CubeMX is correct. If nothing happens, it is worth double-checking the USB connection first, since a loose cable or a board that is not being recognised is a far more common cause of a “nothing happened” moment than a genuine code problem.
It is worth understanding the difference between using Run and using Debug, since both of them flash the chip but behave differently afterward. Run flashes the program and lets it start executing immediately, with no connection back to the IDE. Debug also flashes the program, but it keeps a live connection open between CubeIDE and the chip, which is what allows breakpoints, stepping, and variable inspection to work.
Running and Debugging an STM32 Application
Debugging is where STM32CubeIDE becomes noticeably more useful than simply flashing a program and hoping it behaves as expected. Starting a debug session is done through the bug-shaped icon in the toolbar, or through the Run > Debug menu option.
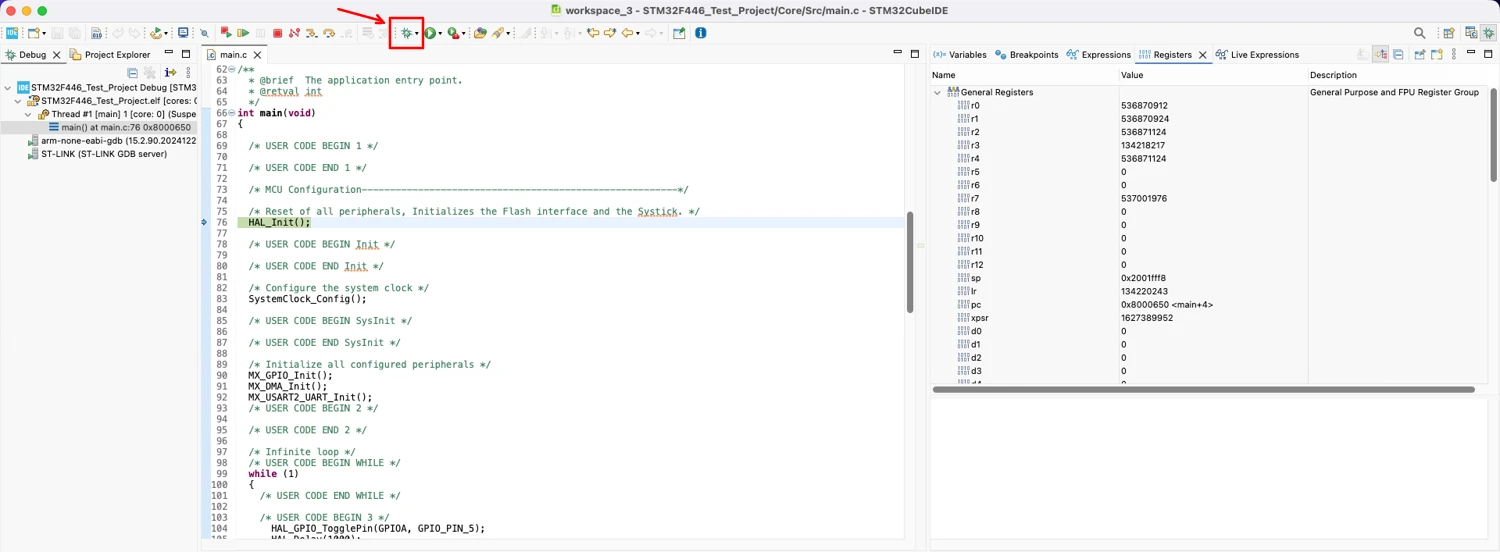
The first time you start a debug session for a project, CubeIDE usually asks whether you want to switch to the Debug perspective. This is a different arrangement of panels inside the same window, designed specifically for stepping through running code. Saying yes rearranges the interface: the source code stays in the middle, but new panels appear around it for things such as the call stack, the list of active breakpoints, and the current values of variables and CPU registers.
Once the debug session starts, CubeIDE flashes the program onto the chip, just as the Run button does, but this time it also halts the processor right at the start of main(), before any of your initialization code has run. From here, you have full control over execution. You can let the program run freely, pause it at any moment, or step through it one line, or even one machine instruction, at a time.
The main controls for this are located in the toolbar at the top of the Debug perspective. They map closely to what you would expect:
- Resume continues running until the next breakpoint or until you pause it manually
- Suspend pauses a running program immediately
- Terminate ends the debug session and disconnects from the chip.
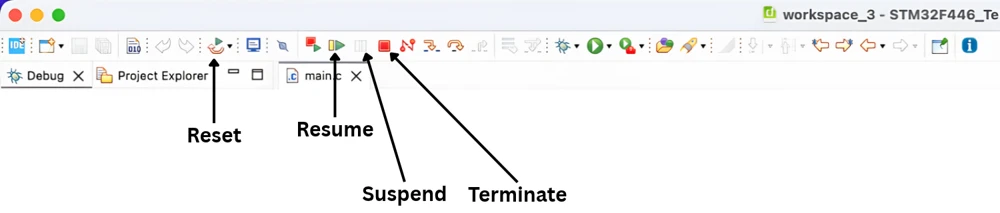
Getting comfortable with these three alone is enough to debug most simple problems.
Breakpoints, Watch Variables and Stepping
A breakpoint tells the debugger to pause execution automatically whenever the program reaches a particular line of code. Setting one is done by double-clicking in the narrow margin on the left edge of the editor, next to the line you want to pause on. You can also set it by right click on the line number and then selecting “Toggle Breakpoint”. A small blue dot appears next to that line, marking it as a breakpoint.
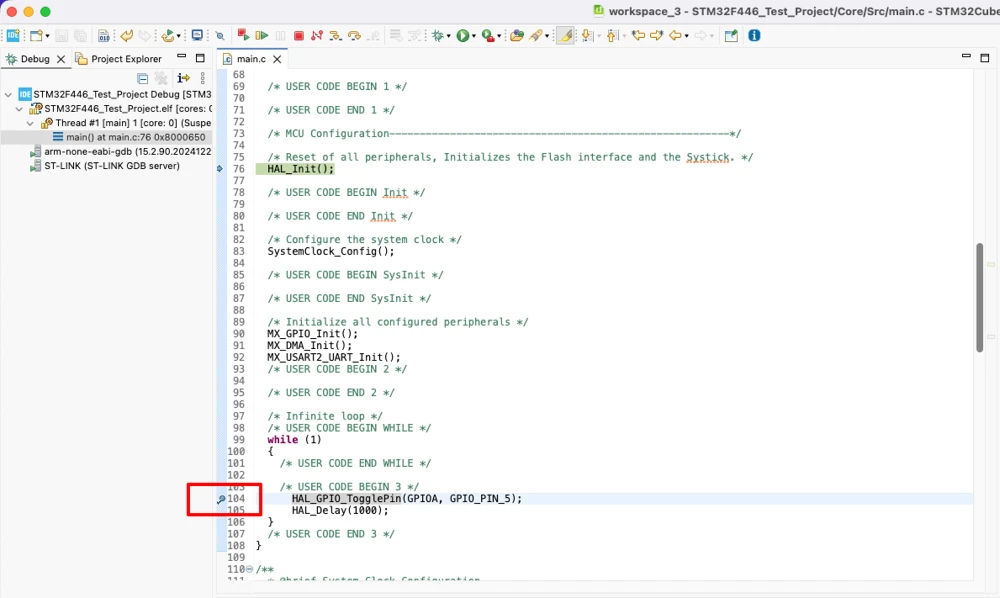
For the working example, setting a breakpoint on the HAL_GPIO_TogglePin() line inside the loop and then resuming the program shows this behaviour clearly. The program runs, the LED toggles once, and execution stops right there, with the current line highlighted in the editor. Resuming again lets the program run until it reaches that same line a second time.
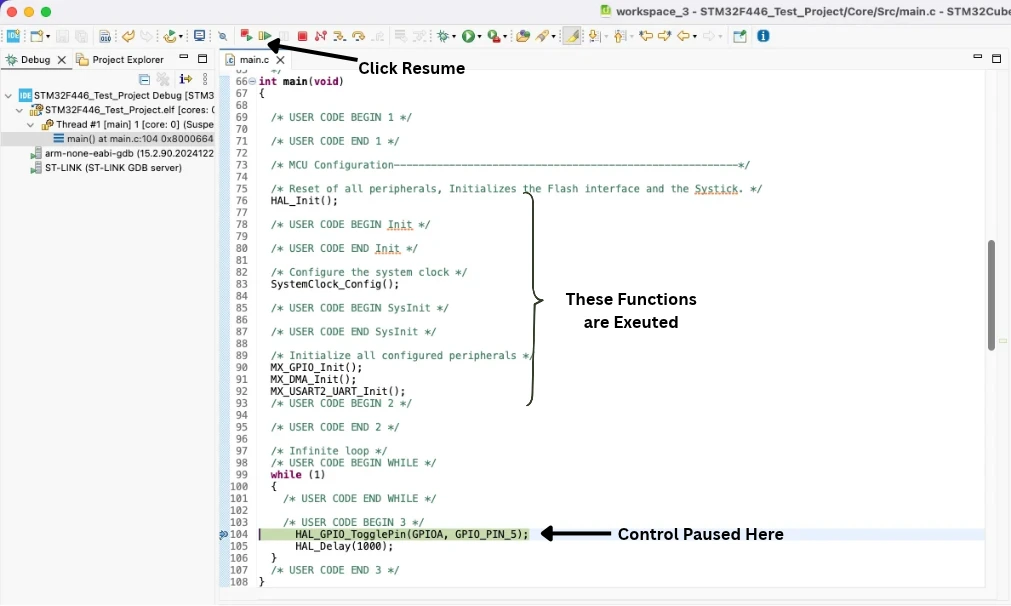
Stepping gives finer control once execution is paused.
- Step Into moves execution forward by a single line, and if that line is a function call, it follows execution into that function.
- Step Over also moves forward by a single line, but if that line calls a function, it runs the entire function without stopping inside it, which is usually what you want when the function in question is something you already trust, such as a HAL library call.
- Step Return runs until the current function finishes and returns control to whatever called it.
These three step commands, used together, are how most line-by-line debugging actually happens in practice.

Watching variables is done through the Variables panel, which by default shows local variables currently in scope, and updates automatically every time execution pauses. For anything not shown there automatically, right-clicking a variable name in the source code and choosing Add Watch Expression adds it permanently to the Expressions panel, where you can track its value across the entire debug session, not just while it happens to be in scope.
The Registers panel, sitting alongside the Variables panel, shows the live contents of the CPU’s core registers and, if expanded, many of the peripheral registers too. This is a more advanced tool, and most day-to-day debugging does not require looking at it directly, but it becomes useful when a problem seems to be happening at a level below your own variables, such as a peripheral not behaving the way its configuration suggests it should.
Understanding Build and Debug Configurations
STM32CubeIDE separates build settings into build configurations, and the two you will see by default in a new project are Debug and Release.
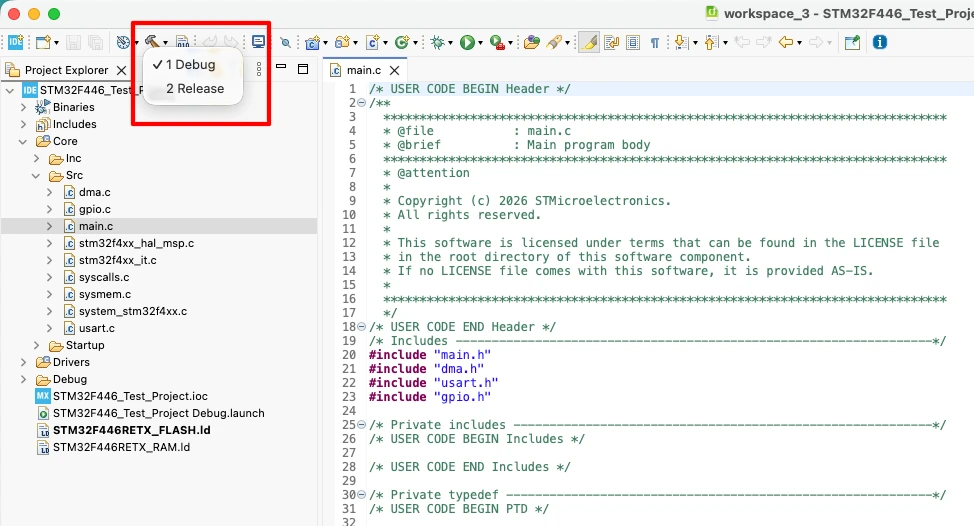
The Debug configuration compiles code with optimisation turned off or set to a very low level, and includes extra debugging information in the output file. This makes the resulting program larger and somewhat slower, but it also means that when you step through the code, what you see on screen matches what is actually happening on the chip, line by line. This is almost always the configuration you want while developing and testing a project.
The Release configuration compiles the same source code with optimisation turned on, which produces smaller and faster code, closer to what you would actually want to ship in a finished product. The trade-off is that a Release build is much harder to debug. The compiler is allowed to reorder, combine, or even remove parts of your code to make it run faster. This means that when you try to step through it line by line, the flow can look confusing, and sometimes you cannot follow it accurately at all.
It is common practice to develop and debug almost entirely in the Debug configuration, and only switch to Release once a project is close to finished, purely to check that it still behaves correctly once optimisation is applied.
CubeIDE also has debug configurations, separate from build configurations. You can find them through the small dropdown arrow next to the Debug icon in the toolbar. Here you can change a few settings. You can pick which debug probe to use, if you have more than one connected. You can choose whether the chip’s flash memory gets fully erased before programming. You can also pick which interface to use, SWD or JTAG, to talk to the chip.
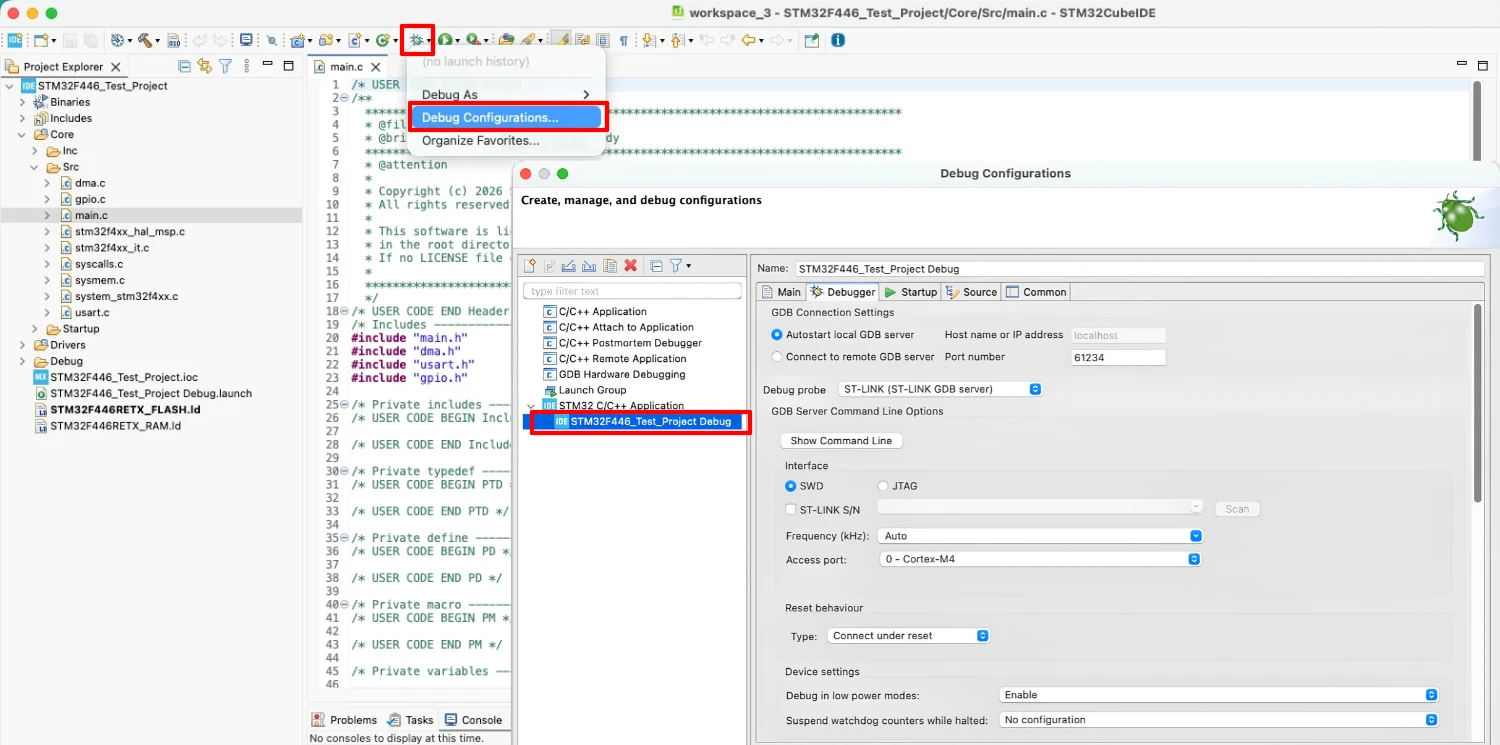
If you are using a single board connected over USB, the default debug configuration is almost always correct as it is. You will not need to touch this screen much at this stage. It becomes more useful once you start working with custom hardware or with multiple boards connected at the same time.
Common Build and Flashing Errors
A few problems come up again and again when people start using STM32CubeIDE. It helps to know about them ahead of time.
“No ST-LINK detected” or a similar connection error
This is almost always a cable problem. Check that the USB cable is plugged in properly at both ends. Try a different cable if you have one, since some cables only carry power and not data. That is a common cause of this exact error. On Windows, also check that the ST-LINK drivers are installed. CubeIDE usually prompts you to install them the first time you connect a board.
Build errors after changing the CubeMX configuration
If you go back into the .ioc file, make a change, and regenerate the code, you might get a build error about a function or variable that no longer exists. This usually means one of two things. Either you wrote some code outside the USER CODE markers and it got wiped out during regeneration, or a peripheral your code depends on got turned off. Read the exact error message before you assume something is broken. That alone solves most of these cases.
A build that succeeds but a program that does not seem to run
This is usually not a build problem at all. Check that you have the right build configuration selected. Check that the Console panel showed a successful flash. Then check the wiring on your board and compare it to the pin setup in CubeMX. If your example worked before you changed something on the hardware side, the software is probably fine. The issue is most likely in the wiring.
Flash memory showing full or almost full on a small chip
You will see this in the build summary after a successful compile. It usually means you have a peripheral or library feature turned on that you do not actually need. Go back into the Project Manager settings in the .ioc file and turn off anything you are not using. That usually fixes it.
Complete Build, Flash, and Debug Workflow
Here is the full process, start to finish, using the LED and button example from the CubeMX guide.
- Open the CubeMX-generated project in STM32CubeIDE. You can import it directly, or open the .ioc file, which loads the project into your workspace.
- Open Core/Src/main.c and find the USER CODE BEGIN 3 marker inside the while (1) loop.
- Add a line to toggle the LED pin on PA5, then add a short delay. Keep both lines inside the marker.
- Save the file and build the project. Use Ctrl+B or the hammer icon. Check the Console panel to confirm the build finished with no errors.
- Connect your board over USB. Press Run to flash the program and start it right away, or press Debug to flash it and pause at the start of main().
- If you are debugging, set a breakpoint on the line that toggles the LED. Resume execution, and watch the program stop there each time it loops around.
- Use Step Over to skip past the delay call without stepping into the HAL library code. Check the Variables panel to see the current values of anything you are tracking.
- Once everything works the way you expect, switch to the Release build configuration and rebuild. This confirms the project still builds and runs correctly with optimisation turned on.
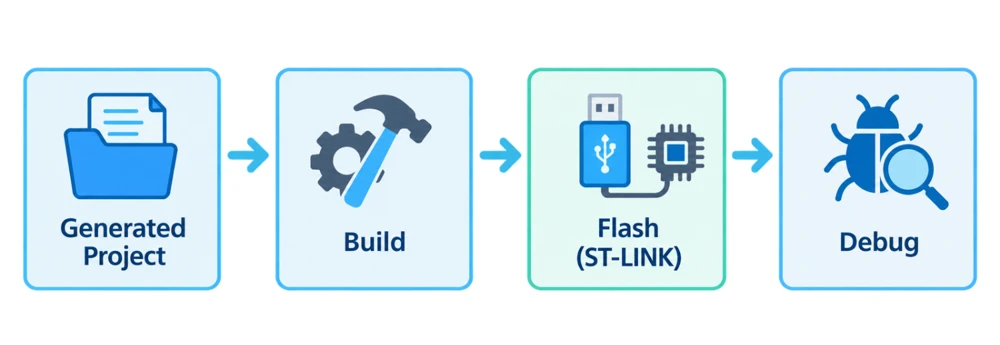
Doing this sequence a few times, even on something as small as one blinking LED, builds habits that carry over to much bigger projects later. The tools barely change as a project grows. You will still use the same build button, the same ST-LINK connection, and the same breakpoints and stepping commands once your project has dozens of files and several peripherals running together.
Wrapping Up
STM32CubeIDE is where a CubeMX project becomes an actual running program. Building turns your source files into a binary the chip can read. Flashing sends that binary onto the hardware through ST-LINK. Debugging gives you a direct look at what the chip is doing while your code runs.
None of this replaces understanding your own code. The debugger will happily show you a variable holding the wrong value, but it will not tell you why your logic put it there. What CubeIDE gives you is a way to see what is actually happening on the chip, instead of guessing from a distance.
Get comfortable with the project structure. Respect the USER CODE markers. Build the habit of reaching for a breakpoint before you reach for a guess. Those three things are what make this tool genuinely useful, rather than just another window to click through.
Download the Project Here
Download the CubeMX project files and HAL source code — all tested on real hardware.
If you find this useful, you can support us with a Donation as well.